One more study (Stroke.1975;6(1):77-84.) supports Kraft’s statement that atherosclerotic diseases like AMI, Stroke, PAOD are hyperinsulinemic states. 61 ischemic thrombotic cardiovascular disease (ITCVD) patients and 61 age-matched control subjects were compared in order to detect risk factors for stroke. OGTT with insulin assays were done for all patients and controls.
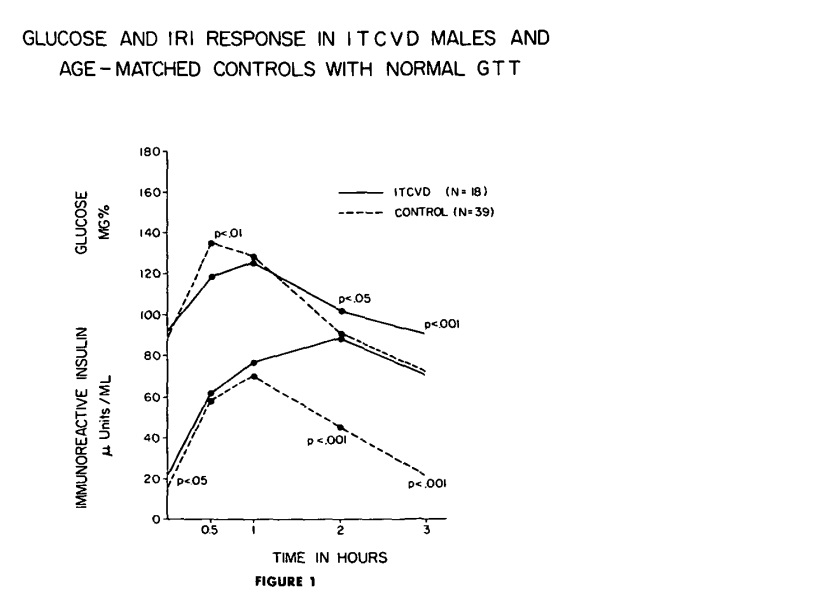
18 ITCVD men and the 39 controls were classified as normal GTT. In fig 1, Glucose curve (upper solid line) of the ITCVD group peaks at one hour while the curve of the control group peaks at one-half hour, although both groups are classified as normal GTT.
The mean insulin response curve (lower solid line) for the ITCVD group has greater values than the controls at all time intervals during the GTT with statistical significance at fasting (P < 0.05), two hours (P < 0.001) and three hours (P < 0.001). In addition, the insulin curve of the ITCVD group has a delayed peak at 2 hours. This means although OGTT is classified as normal, stroke pts have significantly higher insulin levels at fasting, 2 hr & 3 hr time points. If only 2 hr post glucose insulin were checked, hyperinsulinemia could be detected without doing the whole OGTT. It was around 80 microU/mL, so well over Kraft’s criteria of 40 microU/mL. On the other hand, if only OGTT were done without insulin assays, these abnormalities in CHO metabolism in 18 stroke pts would have been missed.
The mean insulin response curve (lower solid line) for the ITCVD group has greater values than the controls at all time intervals during the GTT with statistical significance at fasting (P < 0.05), two hours (P < 0.001) and three hours (P < 0.001). In addition, the insulin curve of the ITCVD group has a delayed peak at 2 hours. This means although OGTT is classified as normal, stroke pts have significantly higher insulin levels at fasting, 2 hr & 3 hr time points. If only 2 hr post glucose insulin were checked, hyperinsulinemia could be detected without doing the whole OGTT. It was around 80 microU/mL, so well over Kraft’s criteria of 40 microU/mL. On the other hand, if only OGTT were done without insulin assays, these abnormalities in CHO metabolism in 18 stroke pts would have been missed.
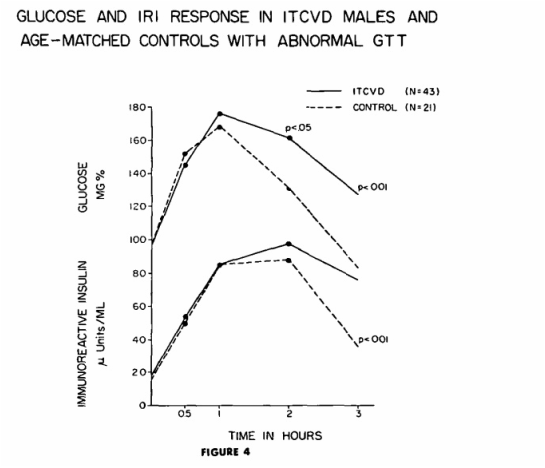
43 stroke patients and 21 control subjects were classified as abnormal GTT. In fig 4, it is obvious that 2 hr post glucose insulin level of both stroke and controls are around 80 microU/mL, so well over cutoff level of 40 microU/mL. These people (43+21) with abnormal CHO metabolism can be detected by OGTT without insulin assay.
 RSS 訂閱
